


Last week, I looked at the rough target numbers you need for each category to win the NFBC Main Event. For some background, the Main Event consists of 30 separate 15-team leagues that compete individually for 15 points in each category while simultaneously competing for 450 points per category in the overall contest. For the purposes of this post, I'm looking at the overall dimension of the contest, though any findings will obviously apply to the individual leagues as well:
Here's the relevant chart from last week:
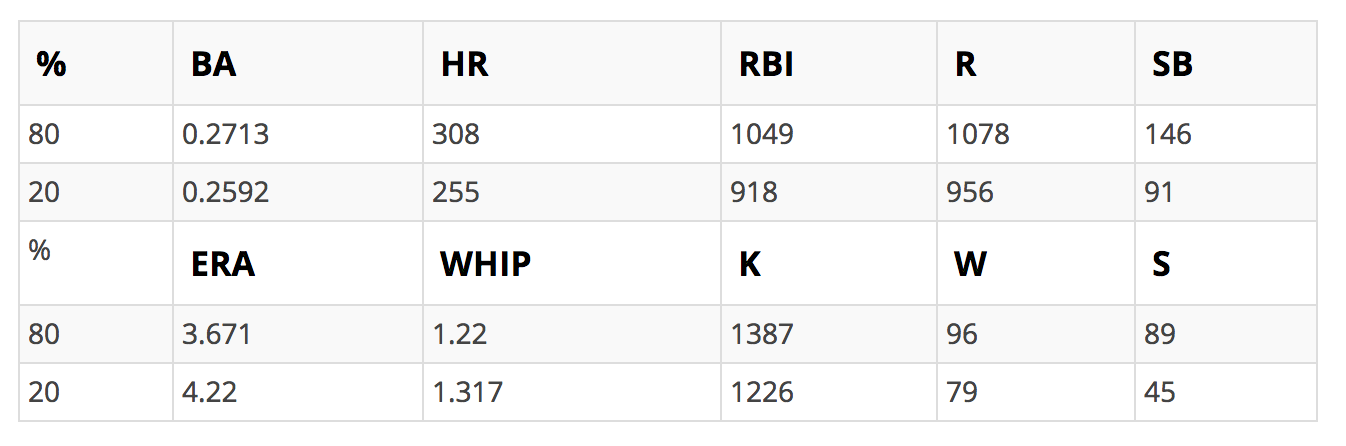 I used the 20th and 80th percentile numbers because the former constitute rough replacement value among teams that are trying all season and the latter the actual targets you need to be within striking distance of the overall title.
It's interesting to note the gap between 20 and 80 isn't all that great - only 12 points of batting average, for example, 17 wins and 53 home runs. While the difference between first and last in batting average (.247 to .287) is far greater (40 points to 12), 60 percent of the distance between the two is comprised of the 12 points between .259 and .271. That's because the distribution of teams' categorical output is like a bell curve. Most finish somewhere near the mean, and far fewer post outlier totals near the top or bottom.
That means most of the battle is fought in the 20 to 80 range in each category. While there's nothing wrong with going from 80 to 100, it's not an efficient distribution of your production. For example, those 53 home runs get you from 90 to 360 out of 450 overall points. But to get from 360 to 450, you'd need 47 more, i.e., nearly as meany as it took to move up 270 spots. The more balanced your team, the easier it is to move up in the standings.
The question still remains how to make the move from 20 to 80, or more precisely, how to determine which players move the needle and by how much in each category. For example, it's far from obvious how much an elite closer helps you relative to a 4th-5th round hitter. If you look at Steamer projections and run them through my formula, you can see Aroldis Chapman (NFBC ADP 46) is worth $13.82 (using a 70/30 hitting/pitching split) in a 12-team league while Dee Gordon (ADP 45) is worth $14.79. By that measurement, you might be inclined to take Gordon, but these valuations have to be put into context. To compete for the NFBC overall title, it's imperative to make a strong showing in all 10 categories, and therefore teams almost universally dedicate two of their nine pitching slots to closers, even if doing so is suboptimal from a player-valuation standpoint. Put differently, instead of nine pitching slots of any kind, the NFBC is played virtually as if there are two dedicated closer slots, six starter slots and one pitcher flex. This has implications for Chapman's value as he's essentially competing only against only closers and not the entire pool of pitchers.
To illustrate, my 15-team NFBC Main Event team logged 1436 IP last year. The team that won my individual league logged 1513, the team that took second, 1415. If we average the three, it comes out to roughly 1450 IP. (I realize I could be more rigorous here, but I only have access to the teams in my league, and whether the real number is 1430 or 1470 is beside the point.)
So that 1450 IP is the total output from one's nine pitching slots. If we assume on average six of those slots go to starting pitchers, two to relievers and one to a flex, we wind up with something like 200 IP per starting slot * six = 1200 IP, plus two * 65 = 130, plus one * 120 = 1450 IP total. Keep in mind, I'm not saying your starting pitchers will average 200 IP each, but that their roster *slots* will if you're active all year and don't have especially bad luck.
In Chapman's case, we should look at what his 65-70 IP get you over the 20th percentile teams' relievers. They'll get nearly one strikeout per inning, while Chapman (Steamer 104K in 65 IP) will get 40 more. You can compare him to Corey Kluber who Steamer projects to strikeout 221 batters in 211 innings. If the 20th percentile team in strikeouts (Team A) had 1226 Ks in 1375 IP (that too will be lower), that's a rate of 8.0 K/9. And let's drop it down to 7.8 or so because that team is likely getting nearly a strikeout per inning from its relievers and less from its starters. So at 7.8 K/9 over 200 innings, that slot is getting 173 strikeouts. But Kluber is going deeper into games, doesn't get skipped, etc. and gets 221 Ks over 211 IP in that same slot, for a gain over replacement of 48 Ks in that case. So Chapman is worth 40 Ks more than the reliever occupying his slot on Team B, and Kluber is worth 48 more than the starter for Team A. Both are moving you a substantial part of the way from 1226 Ks (20th percentile) toward 1387 Ks (80th percentile.) But the key takeaway is Chapman's 104 strikeouts in this context are worth nearly as much as Kluber's 221! This would not be the case in a format where people didn't play as though there were two relief slots and had no problem going nine starters if it were optimal overall.
Just as catcher values need to be adjusted for scarcity, closers in a sense play a separate and scarce position too. One can do this for all of the categories, and you can see how much a particular player moves the needle over the key territory you need to gain between 20 and 80th percentile in order to compete in the over contest.